High Performance Go
阅读学习 Dave Cheney 的讲座 High Performance Go 的笔记。
本讲座的目的是提供帮助诊断和修复Go程序中的性能问题的工具。
1. Benchmarking
在试图提升代码性能前,首先要知道它当前的性能是如何的。
1.1. Benchmarking ground rules
benchmark运行的环境必须是稳定的,才能得出可重复的(repeatable)的结果。
- 机器要是空闲的——不要在共享的硬件上测量,不要在benchmark运行时浏览网页。
- 当心电脑的节能策略。
- 避免在虚拟机和共享的云主机上测试。
1.2. Using the testing package for benchmarking
这里举了一个计算斐波拉切数列的函数的例子来作benchmark。
func BenchmarkFib20(b *testing.B) {
	for n := 0; n < b.N; n++ {
		Fib(20) // run the Fib function b.N times
	}
}

func BenchmarkFib28(b *testing.B) {
	for n := 0; n < b.N; n++ {
		Fib(28) // run the Fib function b.N times
	}
}
1.2.1. Running a package’s benchmarks
当执行go test命令时,默认地会排除benchmark测试。需要使用-bench来显式地运行benchmark。-bench的参数值是待运行的测试名称的正则表达式。例如:
% go test -bench=. ./examples/fib/
goos: darwin
goarch: amd64
pkg: high-performance-go-workshop/examples/fib
BenchmarkFib20-8           28947             40617 ns/op
PASS
ok      high-performance-go-workshop/examples/fib       1.602s
1.2.2. How benchmarks work
b.N是benchmark测试运行的迭代次数。
上述结果中的-8后缀是指运行该测试使用的GOMAXPROCS的值,这个数字的默认值是机器的CPU数量。可以使用-cpu来指定测试运行的CPU数,例如:
% go test -bench=. -cpu=1,2,4 ./examples/fib/
1.2.3. Go 1.13 benchmarking changes
略
1.2.4. Improving benchmark accuracy
为了增大迭代次数,可以使用-benchtime来增长测试时间,例如:
% go test -bench=. -benchtime=10s ./examples/fib/
goos: darwin
goarch: amd64
pkg: high-performance-go-workshop/examples/fib
BenchmarkFib20-8          313048             41673 ns/op
PASS
ok      high-performance-go-workshop/examples/fib      13.442s
这个意思是,持续运行该基准测试直到其达到一个较大的b.N的值,使得测试需要不少于10s的时间来完成(指n从0增大到b.N的整个for循环)。
对于每次operation的时间尺度在纳秒级别的测试,指令重排(instruction reordering)和代码对齐(code alignment)都会对测试次数产生影响。
一些有用的flag:
-benchtime=10s表示运行基准测试至少10s时间-benchtime=20x表示基准测试运行时循环20次,即b.N=20-count=10表示重复运行10次基准测试
1.3. Comparing benchmarks with benchstat
使用Russ Cox写的benchstat工具来对多次基准测试的结果进行统计和比较。这有助于减少电源管理,后台进程,散热等因素对测试结果带来的影响,
例如:
% go test -bench=Fib20 -count=10 ./examples/fib/ | tee old.txt
goos: darwin
goarch: amd64
pkg: high-performance-go-workshop/examples/fib
BenchmarkFib20-8           30721             37893 ns/op
BenchmarkFib20-8           31468             38695 ns/op
BenchmarkFib20-8           31726             37521 ns/op
BenchmarkFib20-8           31686             37583 ns/op
BenchmarkFib20-8           31719             38087 ns/op
BenchmarkFib20-8           31802             37703 ns/op
BenchmarkFib20-8           31754             37471 ns/op
BenchmarkFib20-8           31800             37570 ns/op
BenchmarkFib20-8           31824             37644 ns/op
BenchmarkFib20-8           31165             38354 ns/op
PASS
ok      high-performance-go-workshop/examples/fib      15.808s

% benchstat old.txt
name     time/op
Fib20-8  37.9µs ± 2%
这里,benchstat告诉我们平均结果是37.9微秒,上下波动2%。
1.3.1. Improve Fib
首先用go test -c命令将当前的测试二进制保存下来,并另存为 fib.golden文件:
% go test -c
% mv fib.test fib.golden
然后优化Fib函数,再次保存测试二进制为fib.test文件。
执行两个测试二进制,得到测试结果,使用benchstat对前后两次结果做比较:
% ./fib.golden -test.bench=. -test.count=10 > old.txt
% ./fib.test -test.bench=. -test.count=10 > new.txt
% benchstat old.txt new.txt
name     old time/op  new time/op  delta
Fib20-8  37.9µs ± 2%  24.1µs ± 3%  -36.26%  (p=0.000 n=10+10)
从中可看出,优化后性能有所提升。
注意:一般认为波动值在1~2%是好的,3~5%还行,再大的话测试结果就不太可靠了。
1.3.2. Beware the p-value
p值是统计学中的概念,如果p值大于0.05,说明这个基准测试结果从统计学角度看不是显著的。
1.4. Avoiding benchmarking start up costs
如果基准测试函数中需要包含一些不想被纳入测试计时的代码,可以用 b.ResetTimer(用在循环体外)或者 b.StopTimer/b.StartTimer(用在循环体内)来规避。例如:
func BenchmarkExpensive(b *testing.B) {
        boringAndExpensiveSetup()
        b.ResetTimer()
        for n := 0; n < b.N; n++ {
                // function under test
        }
}

//

func BenchmarkComplicated(b *testing.B) {
        for n := 0; n < b.N; n++ {
                b.StopTimer()
                complicatedSetup()
                b.StartTimer()
                // function under test
        }
}
1.5. Benchmarking allocations
测试内存分配情况,有两种方法:
(1)在测试函数体里添加:b.ReportAllocs()
(2)使用 go test -benchmem 执行测试
1.6. Watch out for compiler optimisations
注意:编译器的内联优化可能导致某些基准测试失效。
profiling benchmark: 支持在运行基准测试时生成CPU,memory,block的profile:
- -cpuprofile=$FILE
- -memprofile=$FILE, -memprofilerate=N 设置profile rate为1/N
- -blockprofile=$FILE 使用以上三个flag中的任意一个都会产生测试二进制文件 xxx.test。 生成的profile文件可以用pprof来分析。
问题:blockprofile是啥?profile rate 是啥?
2. Performance measurement and profiling
前面的部分里我们看了下对特定的函数做基准测试,这在我们提前知道瓶颈在哪里时是有用的。然而,我们常常会发问
“为什么程序这么慢?”
对整个程序做profiling对回答这个问题是有用的。在这个部分中,我们将使用Go内置的profiling工具来对程序内部的操作做调查分析。
2.1. pprof
第一个工具是pprof。它是从Google Perf Tools工具集衍生而来的,已经被集成到了Go的运行时。
pprof由两部分组成:
- 每个Go程序都有的
runtime/pprof包 - 用于分析profiles的
go tool pprof
2.2. Types of profiles
pprof支持几种类型的profiling,我们将讨论这些中的三种:
- CPU profiling
- 内存 profiling
- Block (或者blocking)profiling
- Mutex contention(互斥锁争抢)profiling
2.2.1. CPU profiling
CPU profiling是最常见的profile,也是最显然的。
当CPU profiling开启时,运行时会每10ms打断自己,记录当前运行的goroutine的栈追踪(stack trace)。
profile完成后,我们可以对它进行分析来判断“最热”的代码路径。
一个函数在profile中出现的次数越多,这个代码路径在整个运行时中的时间占比就越大。
2.2.2. Memory profiling
内存profiling在发生堆分配(heap allocation)时记录栈追踪。
栈分配(stack allocation)被认为是免费的,不会在内存profile中被记录。
内存profiling,就像CPU profiling,是基于采样的。默认地内存profiling在每1000次堆分配中采样1次。这个比例可以修改。
因为内存profiling是基于采样的,并且追踪了未被使用的allocations,所以使用内存profiling来判断程序的整体内存使用是很难的。
译注: TODO :什么叫做“未使用的allocations”? 是指分配了但没有被使用,所以不会计入内存使用量吗?
作者个人观点:我不认为内存profiling在寻找内存泄漏时是有用的。有更好的方法来查出程序用了多少内存。我们将在后续讨论这个。
2.2.3. Block profiling
Block profiling是Go中比较独特的。
Block profile和CPU profile类似,但是它记录了goroutine在等待共享资源(shared resource)时花费的时间。
这在分析并发(concurrency)瓶颈时很有用。
译注:由此可知,block是“阻塞”的意思,而不是“块”。
Block profiling可以显示出什么时候大量的goroutines本可以(could)运行,但被阻塞住(blocked)。Blocking包括了:
- 对一个无缓冲区的channel发送或接收
- 发送给一个满的channel,从一个空的channel接收
- 试图
Lock一个已经被其他goroutine锁住的sync.Mutex
Block profiling是一个非常特别的工具。你应该在确认已经消除了所有的CPU和内存使用瓶颈时再使用它。
2.2.4. Mutex profiling
Mutex profiling和Block profiling类似,但它仅仅集中在那些因为互斥锁争抢(mutex contention)而延迟的操作。
Mutex profile不会显示出程序运行了多久,或者什么最耗时。它报告的是在等待锁是花费了多少时间。就像blocking profile一样,它说明了在等待某个资源时花的时间。
换句话说,mutex profile报告了如果锁争抢(lock contention)被移除,能够省去多少时间。
2.3. One profile at a time
Profiling不是免费的。
Profiling对程序的性能有着适中,但是明显地影响——尤其是在增加内存profile采样率的时候。
大多数工具不会阻止你一次性开启多种profiles。
注意:不要同时开启多种profile。这么做的话,它们之间的相互作用也会被观测到,这会扰乱(throw off)最终结果。
2.4. Collecting a profile
Go运行时的profiling接口在runtime/pprof包中。runtime/pprof是一个非常底层的工具,由于历史原因,对不同种类的profile的接口是不统一的。
我们在前一部分已经看到,pprof profiling 内置在testing包中,但是有时候把要profile的代码放在testing.B基准测试的上下文中并不方便或者很困难,这时就必须直接用runtime/pprof的API。
几年前我写过一个package,使得对一个已存在的应用做profile更简单。
import "github.com/pkg/profile"

func main() {
	defer profile.Start().Stop()
	// ...
}
我们将在本部分使用这个profile包。晚些时候我们再介绍直接使用runtime/pprof的接口。
2.5. Analysing a profile with pprof
我们已经讨论了pprof可以测量什么,以及如何生成一个profile。下面我们来讨论如何使用pprof分析一个profile。
这要使用go pprof命令。
go tool pprof /path/to/your/profile
这个工具提供了几种profiling数据的表现形式:文本,图形,火焰图。
2.5.1. Further reading
2.5.2. CPU profiling (exercise)
package main

import (
	"fmt"
	"io"
	"log"
	"os"
	"unicode"
)

func readbyte(r io.Reader) (rune, error) {
	var buf [1]byte
	_, err := r.Read(buf[:])
	return rune(buf[0]), err
}

func main() {
	f, err := os.Open(os.Args[1])
	if err != nil {
		log.Fatalf("could not open file %q: %v", os.Args[1], err)
	}

	words := 0
	inword := false
	for {
		r, err := readbyte(f)
		if err == io.EOF {
			break
		}
		if err != nil {
			log.Fatalf("could not read file %q: %v", os.Args[1], err)
		}
		if unicode.IsSpace(r) && inword {
			words++
			inword = false
		}
		inword = unicode.IsLetter(r)
	}
	fmt.Printf("%q: %d words\n", os.Args[1], words)
}
来数数Moby Dick小说中有多少个单词。
$ go build main.go && time ./main moby.txt
"moby.txt": 181275 words
./main moby.txt  0.43s user 0.56s system 77% cpu 1.285 total
和wc -w命令的结果对比一下。
$ time wc -w moby.txt
  215829 moby.txt
wc -w moby.txt  0.01s user 0.00s system 90% cpu 0.010 total
可见wc命令的结果要大19%左右,这是因为它判定单词的条件和我们的程序不一样。不过这不太重要。注意到wc要快上许多。
2.5.3. Add CPU profiling
修改程序,开启profiling。
import (
        "github.com/pkg/profile"
)

func main() {
        defer profile.Start().Stop()
        // ...
译者注:在
profile.Start()不传参数就是做CPU profiling。
现在运行程序就会生成一个cpu.pprof文件。
$ go run main.go moby.txt
2022/05/08 18:32:31 profile: cpu profiling enabled, /var/folders/6f/cgm11n_n6r1_960qs_vks9840000gn/T/profile3565126161/cpu.pprof
"moby.txt": 181275 words
2022/05/08 18:32:32 profile: cpu profiling disabled, /var/folders/6f/cgm11n_n6r1_960qs_vks9840000gn/T/profile3565126161/cpu.pprof
拿到pprof文件后,我们就可以用go tool pprof命令做分析了。
$ go tool pprof /var/folders/6f/cgm11n_n6r1_960qs_vks9840000gn/T/profile3565126161/cpu.pprof
Type: cpu
Time: May 8, 2022 at 6:32pm (CST)
Duration: 1.23s, Total samples = 690ms (56.30%)
Entering interactive mode (type "help" for commands, "o" for options)
(pprof) top
Showing nodes accounting for 690ms, 100% of 690ms total
Showing top 10 nodes out of 11
      flat  flat%   sum%        cum   cum%
     680ms 98.55% 98.55%      680ms 98.55%  syscall.syscall
      10ms  1.45%   100%       10ms  1.45%  runtime.asmcgocall
         0     0%   100%      680ms 98.55%  internal/poll.(*FD).Read
         0     0%   100%      680ms 98.55%  internal/poll.ignoringEINTRIO (inline)
         0     0%   100%      680ms 98.55%  main.main
         0     0%   100%      680ms 98.55%  main.readbyte (inline)
         0     0%   100%      680ms 98.55%  os.(*File).Read
         0     0%   100%      680ms 98.55%  os.(*File).read (inline)
         0     0%   100%      680ms 98.55%  runtime.main
         0     0%   100%      680ms 98.55%  syscall.Read (inline)
top是最常用的命令。我们看到绝大部分时间都花在syscall.syscall上了。
我们也可以用web命令可视化这些信息,这会生成一张有向图(svg格式)。里面用到了Graphviz的dot命令。
我们也可以直接启动一个http服务来查看。
$ go tool pprof -http=:8080 /var/folders/6f/cgm11n_n6r1_960qs_vks9840000gn/T/profile3565126161/cpu.pprof
在打开的网页上可以看到有向图和火焰图。
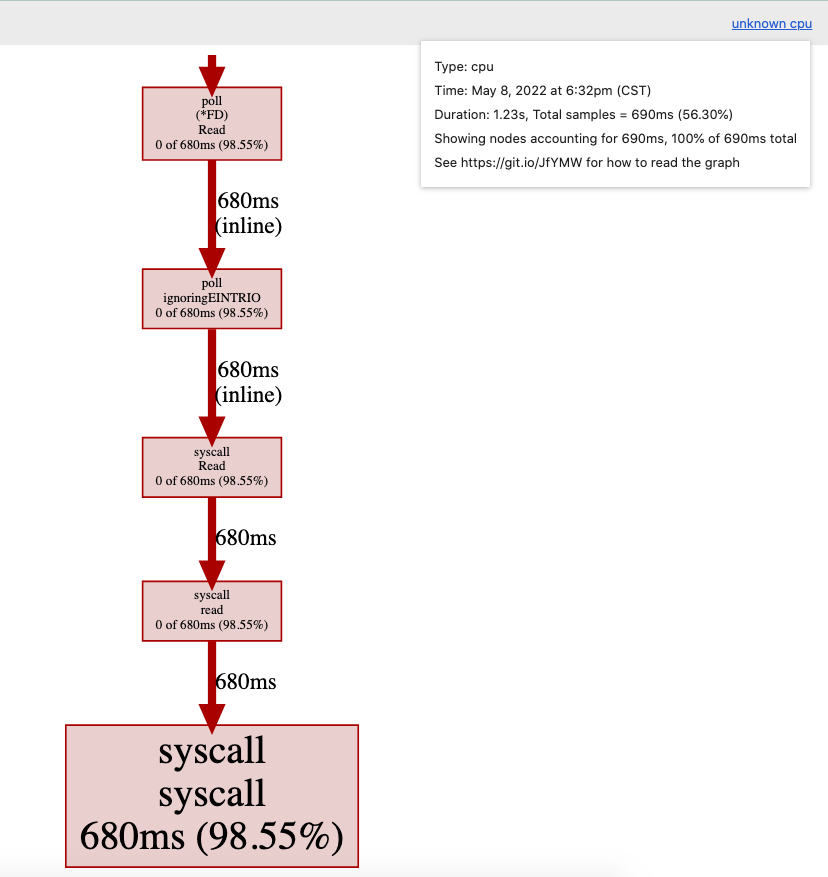
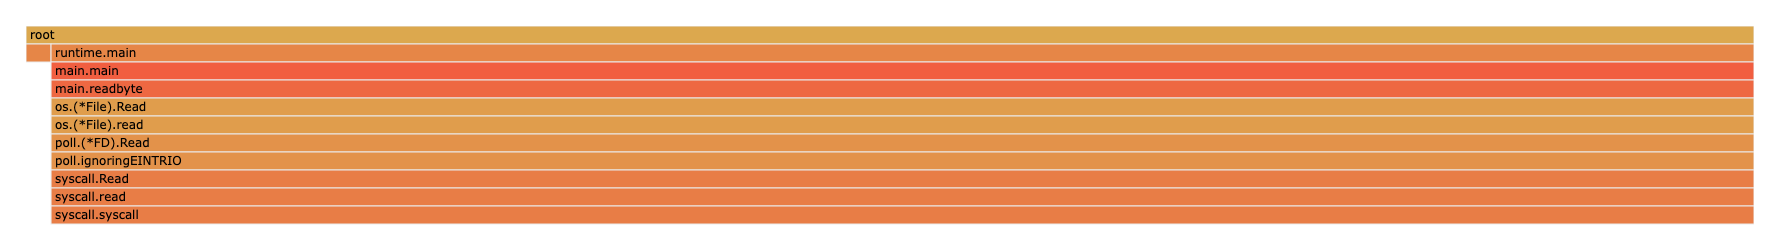
从中再次确认了大部分时间是花费在syscall上的。
2.5.4. Improving our version
我们的程序之所以慢,不是因为Go的syscall.syscall慢,而是因为一般来说syscall就是昂贵的操作。
每个对readbyte的调用都会导致一次buffer大小为1的syscall.Read。所以程序执行syscall的次数和输入的大小相等。
在输入和readbyte之间插入一个bufio.Reader。
func main() {
	f, err := os.Open(os.Args[1])
	if err != nil {
		log.Fatalf("could not open file %q: %v", os.Args[1], err)
	}

	b := bufio.NewReader(f)
	words := 0
	inword := false
	for {
		r, err := readbyte(b)
		if err == io.EOF {
			break
		}
		if err != nil {
			log.Fatalf("could not read file %q: %v", os.Args[1], err)
		}
		if unicode.IsSpace(r) && inword {
			words++
			inword = false
		}
		inword = unicode.IsLetter(r)
	}
	fmt.Printf("%q: %d words\n", os.Args[1], words)
}
这段程序的执行时间是:
$ go build main2.go && time ./main2 moby.txt
"moby.txt": 181275 words
./main2 moby.txt  0.02s user 0.00s system 23% cpu 0.111 total
比上一个版本快了不少。
同样做一下CPU profiling:
$ go run main2.go moby.txt
2022/05/08 19:04:02 profile: cpu profiling enabled, /var/folders/6f/cgm11n_n6r1_960qs_vks9840000gn/T/profile2424648766/cpu.pprof
"moby.txt": 181275 words
2022/05/08 19:04:02 profile: cpu profiling disabled, /var/folders/6f/cgm11n_n6r1_960qs_vks9840000gn/T/profile2424648766/cpu.pprof
结果如下:
$ go tool pprof /var/folders/6f/cgm11n_n6r1_960qs_vks9840000gn/T/profile2424648766/cpu.pprof
Type: cpu
Time: May 8, 2022 at 7:04pm (CST)
Duration: 206.33ms, Total samples = 20ms ( 9.69%)
Entering interactive mode (type "help" for commands, "o" for options)
(pprof) top
Showing nodes accounting for 20ms, 100% of 20ms total
      flat  flat%   sum%        cum   cum%
      20ms   100%   100%       20ms   100%  runtime.madvise
         0     0%   100%       20ms   100%  runtime.(*mheap).alloc.func1
         0     0%   100%       20ms   100%  runtime.(*mheap).allocSpan
         0     0%   100%       20ms   100%  runtime.sysUsed (inline)
         0     0%   100%       20ms   100%  runtime.systemstack
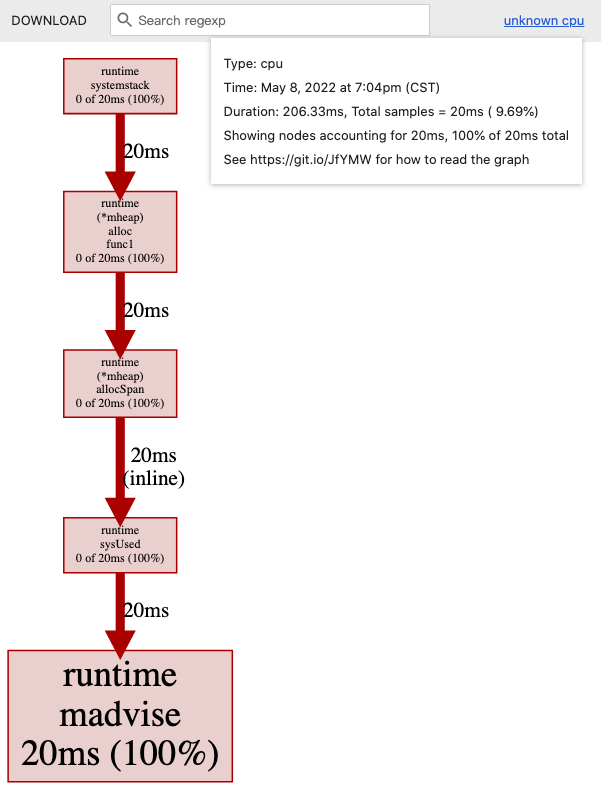

译注:我认为这里变快的原因是不需要一次又一次地读文件了,而是用
b := bufio.NewReader(f)将文件一次性读入。
2.5.5. Memory profiling
添加:
defer profile.Start(profile.MemProfile).Stop()
执行程序:
$ go run main2.go moby.txt
2022/05/08 19:08:50 profile: memory profiling enabled (rate 4096), /var/folders/6f/cgm11n_n6r1_960qs_vks9840000gn/T/profile2817802689/mem.pprof
"moby.txt": 181275 words
2022/05/08 19:08:51 profile: memory profiling disabled, /var/folders/6f/cgm11n_n6r1_960qs_vks9840000gn/T/profile2817802689/mem.pprof
查看pprof文件:
$ go tool pprof -http=:8080 /var/folders/6f/cgm11n_n6r1_960qs_vks9840000gn/T/profile2817802689/mem.pprof
alloc_objects:
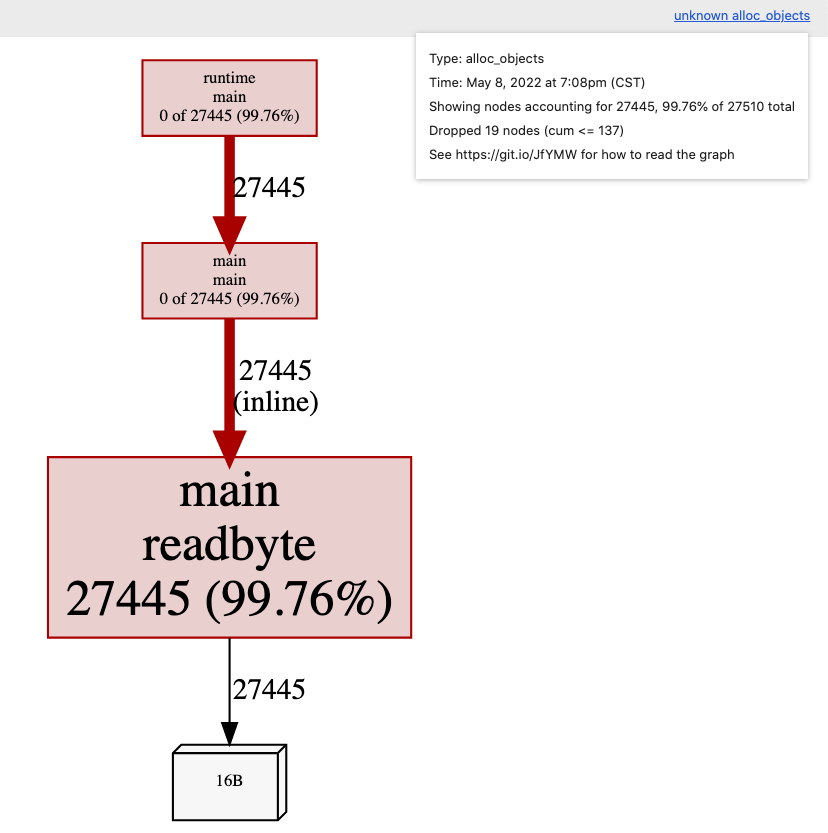
可见绝大部分内存分配来自于readbyte函数,这也是预期内的。
func readbyte(r io.Reader) (rune, error) {
        var buf [1]byte   // 发生内存分配
        _, err := r.Read(buf[:])
        return rune(buf[0]), err
}
每次对readbyte的调用都会分配一个字节长度的数组,这个数组会分配在堆上。
有什么办法可以避免这个分配呢?
一个常见的思路是复用该数组,作者给出了改良版的程序:
// +build none

package main

import (
	"bufio"
	"fmt"
	"io"
	"log"
	"os"
	"unicode"
)

type bytereader struct {
	buf [1]byte
	r   io.Reader
}

func (b *bytereader) next() (rune, error) {
	_, err := b.r.Read(b.buf[:])
	return rune(b.buf[0]), err
}

func main() {
	f, err := os.Open(os.Args[1])
	if err != nil {
		log.Fatalf("could not open file %q: %v", os.Args[1], err)
	}

	br := bytereader{
		r: bufio.NewReader(f),
	}
	words := 0
	inword := false
	for {
		r, err := br.next()
		if err == io.EOF {
			break
		}
		if err != nil {
			log.Fatalf("could not read file %q: %v", os.Args[1], err)
		}
		if unicode.IsSpace(r) && inword {
			words++
			inword = false
		}
		inword = unicode.IsLetter(r)
	}
	fmt.Printf("%q: %d words\n", os.Args[1], words)
}
新版程序的执行时间是:
$ time ./main3 moby.txt
"moby.txt": 181275 words
./main3 moby.txt  0.02s user 0.00s system 95% cpu 0.021 total
内存profiling结果,alloc_objects——
数组的内存分配在图中已经不可见了。
2.5.6. Alloc objects vs. inuse objects
内存profile有两种,根据go tool pprof后的flag来区分。
-alloc_objects报告了每个allocation的调用点-inuse_objects报告了在profile结束时所有可触达(reachable)的allocation的调用点
const count = 100000

var y []byte

func main() {
	defer profile.Start(profile.MemProfile, profile.MemProfileRate(1)).Stop()
	y = allocate()
	runtime.GC()
}

// allocate allocates count byte slices and returns the first slice allocated.
func allocate() []byte {
	var x [][]byte
	for i := 0; i < count; i++ {
		x = append(x, makeByteSlice())
	}
	return x[0]
}

// makeByteSlice returns a byte slice of a random length in the range [0, 16384).
func makeByteSlice() []byte {
	return make([]byte, rand.Intn(2^14))
}
我们设置了memory profile rate是1,也就是记录所有的allocation的栈追踪。
$ go run main.go
2022/05/08 16:34:23 profile: memory profiling enabled (rate 1), /var/folders/6f/cgm11n_n6r1_960qs_vks9840000gn/T/profile2716880970/mem.pprof
2022/05/08 16:34:23 profile: memory profiling disabled, /var/folders/6f/cgm11n_n6r1_960qs_vks9840000gn/T/profile2716880970/mem.pprof
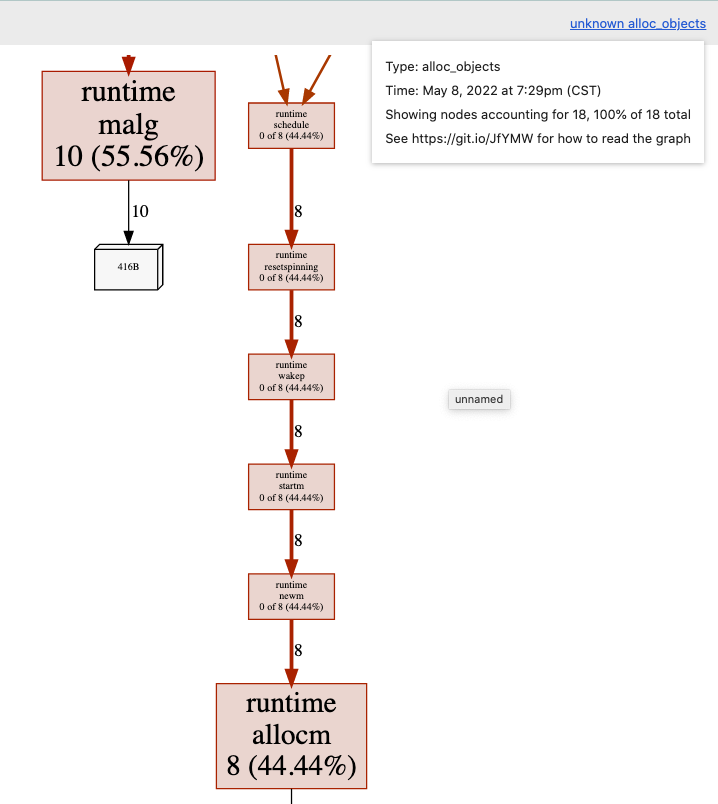
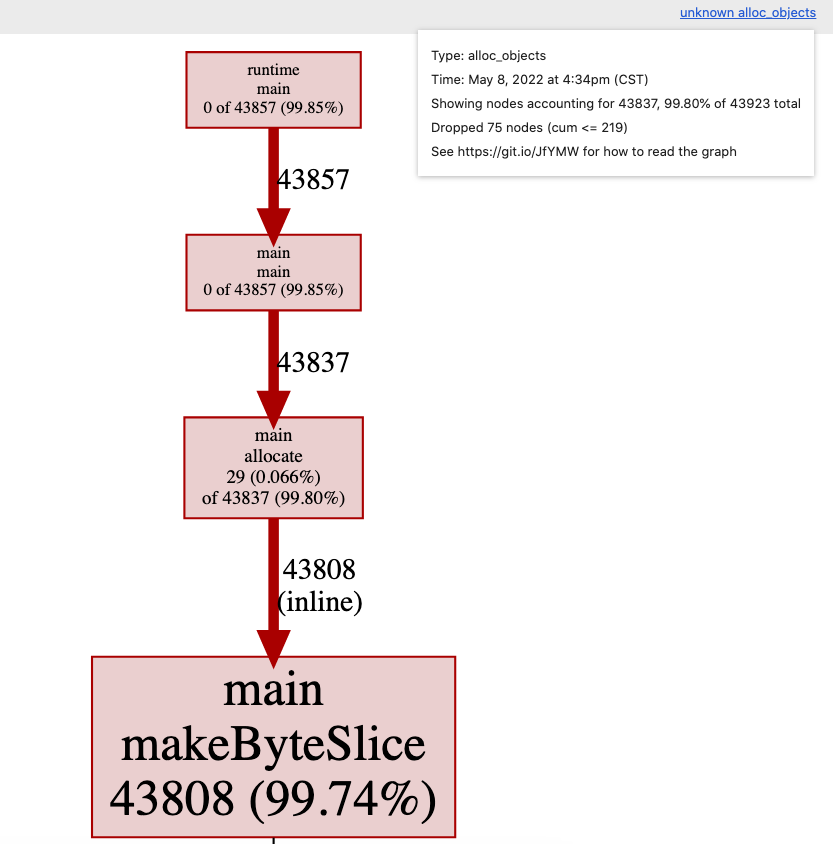
我们来看一下分配对象(allocated objects)的图,这也是默认选项。这显示了在profile期间导致所有对象分配的调用图。
go tool pprof -http=:8080 /var/folders/6f/cgm11n_n6r1_960qs_vks9840000gn/T/profile2716880970/mem.pprof
打开 http://localhost:8080/ui/?si=alloc_objects 查看,可以看到99%以上的分配都发生在makeByteSlice函数里。
我们再用-inuse_objects命令查看同一个profile文件。
译者注:在新版的Go里,-inuse_objects和-alloc_objects都是不再使用的参数了。浏览器网页的SAMPLE下拉列表里可以选择。
$ go tool pprof --help
...
  Legacy convenience options:
   -inuse_space           Same as -sample_index=inuse_space
   -inuse_objects         Same as -sample_index=inuse_objects
   -alloc_space           Same as -sample_index=alloc_space
   -alloc_objects         Same as -sample_index=alloc_objects
   -total_delay           Same as -sample_index=delay
   -contentions           Same as -sample_index=contentions
   -mean_delay            Same as -mean -sample_index=delay
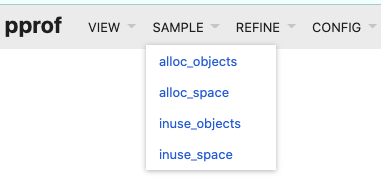
网页 http://localhost:8080/ui/?si=inuse_objects 内容:
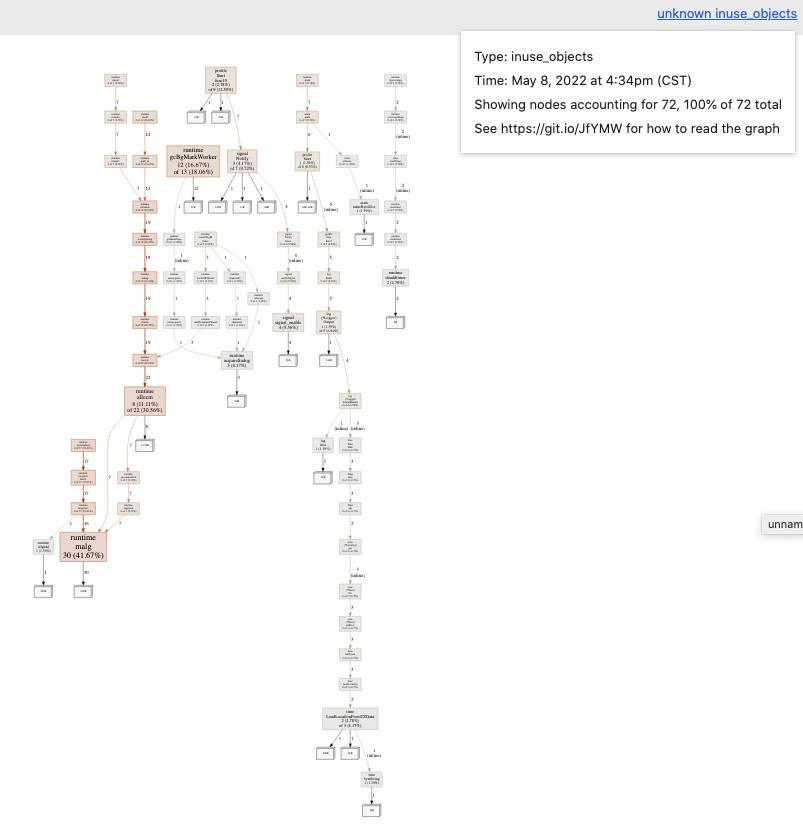
我们看到的不是在profile期间分配(allocated)的对象,而是在profile时剩下来依旧使用(in use)的对象,这里忽略了被垃圾收集器回收的对象的栈追踪。
译注:我还是不懂allocated和in use的的区别是啥?找了一些相关资料如下。
在runtime/pprof包的文档中有一段说明:
The heap profile tracks both the allocation sites for all live objects in the application memory and for all objects allocated since the program start. Pprof’s -inuse_space, -inuse_objects, -alloc_space, and -alloc_objects flags select which to display, defaulting to -inuse_space (live objects, scaled by size).
The allocs profile is the same as the heap profile but changes the default pprof display to -alloc_space, the total number of bytes allocated since the program began (including garbage-collected bytes).
也有网友总结:
inuse_space: Amount of memory allocated and not released yet (Important).inuse_objects: Amount of objects allocated and not released yet.alloc_space: Total amount of memory allocated (regardless of released).alloc_objects: Total amount of objects allocated (regardless of released).
所以理解下来,两者的区别就是——inuse指的是在使用中的,还没被释放的;allocated指的是被分配的,不管有没有被释放都计算在内。
2.5.7. Block profiling
我们要看的最后一种profile类型是block profiling。我们将使用net/http包中的 ClientServer基准测试。
$ go test -run=XXX -bench=ClientServer$ -blockprofile=/tmp/block.p net/http
goos: darwin
goarch: amd64
pkg: net/http
cpu: Intel(R) Core(TM) i7-9750H CPU @ 2.60GHz
BenchmarkClientServer-12    	   17996	     65250 ns/op	    5007 B/op	      59 allocs/op
PASS
ok  	net/http	2.888s
$ go tool pprof -http=:8080 /tmp/block.p
Serving web UI on http://localhost:8080
译注:这里先用
-blockprofile命令生成block profile文件,然后用go tool pprof命令对生成的profile文件作展示。
2.5.8. Mutex profiling
互斥锁争抢会随着goroutine的数量增加而增加。
type AtomicVariable struct {
	mu  sync.Mutex
	val uint64
}

func (av *AtomicVariable) Inc() {
	av.mu.Lock()
	av.val++
	av.mu.Unlock()
}

func BenchmarkInc(b *testing.B) {
	var av AtomicVariable

	b.RunParallel(func(pb *testing.PB) {
		for pb.Next() {
			av.Inc()
		}
	})
}
基准测试结果:
$ go test -bench=. -cpu=1,2,4,8,16 .
goos: darwin
goarch: amd64
cpu: Intel(R) Core(TM) i7-9750H CPU @ 2.60GHz
BenchmarkInc            91910521                12.88 ns/op
BenchmarkInc-2          72791306                15.37 ns/op
BenchmarkInc-4          33680726                33.66 ns/op
BenchmarkInc-8          25016323                59.36 ns/op
BenchmarkInc-16         22006458                71.41 ns/op
PASS
ok      _/Users/chenluxin/Codes/go/high-performance-go-workshop/examples/mutex  9.725s
2.5.9. frame pointers
Go 1.7 发布了amd64的新编译器,这个编译器默认开启了frame pointers(帧指针)。
帧指针是一个寄存器,总是指向当前栈帧的顶部。
帧指针使得像gdb(1)和perf(1)的工具能够理解Go的调用栈。
我们不会继续讨论这些工具。你可以看我做过的关于profile Go程序的七种方法的演讲。
- Seven ways to profile a Go program (slides)
- Seven ways to profile a Go program (video, 30 mins)
- Seven ways to profile a Go program (webcast, 60 mins)
2.5.10. Exercise
略
2.6. Discussion
There are only three optimizations: Do less. Do it less often. Do it faster. The largest gains come from 1, but we spend all our time on 3.
3. Compiler optimisations
这一部分论述Go编译器做的一些优化。比如:
- 逃逸分析(Escape analysis)
- 内联(Inlining)
是在编译器的前端处理的,这时代码依旧是AST的形式;然后代码被传递给SSA(Static single assignment form)编译器做进一步的优化,包括:
- 死代码消除(Dead code elimination)
- 边界检查消除(Bounds check elimination)
- Nil检查消除(Nil check elimination)
3.1. History of the Go compiler
略
3.2. Escape Analysis
为了说明逃逸分析是做什么的,回想下在Go Spec中并没有提到堆或者栈。它只提到了这门语言是有垃圾回收的,并没有给出任何这是如何达到的提示。
一个符合Go Spec的Go实现可以将所有的内存分配置于堆上。这会给垃圾回收器带来很大的压力,但这不能说是错的;多年以来,gccgo对逃逸分析的支持力度就很小,因此可以被认为是以这种模式运行的。
Goroutine的栈用来存储局部变量。对于栈上的变量不需要做垃圾回收,因为它们会在函数返回时自动回收。所以,当安全时,在栈上分配内存可以提高程序效率。
在一些语言,比如C/C++中,需要程序员自己决定选择在堆还是在栈上分配内存——通过malloc和free做堆分配,通过alloca做栈分配。如果选择有误,会带来内存方面的bug。
在Go中,这部分工作由编译器完成的。如果一个值的寿命超出了函数调用的生命周期,那么编译器会自动将该值移动到堆中,这叫做逃逸到堆。
type Foo struct {
	a, b, c, d int
}

func NewFoo() *Foo {
	return &Foo{a: 3, b: 1, c: 4, d: 7}
}
这段程序中,NewFoo函数中分配的Foo变量就会逃逸到堆中,因为它是作为函数的返回值,在函数调用结束后还可能会被用到。
但是编译器也可以反过来做:将本该分配在堆上的变量移动到栈上。例如:
func Sum() int {
	const count = 100
	numbers := make([]int, count)
	for i := range numbers {
		numbers[i] = i + 1
	}

	var sum int
	for _, i := range numbers {
		sum += i
	}
	return sum
}

func main() {
	answer := Sum()
	fmt.Println(answer)
}
这段程序中,编译器会把numbers切片存储在栈上,因为这个变量只在Sum函数中被使用。这样就免去了对numbers变量的GC了,它会在Sum函数返回时自动回收。
3.2.1. Prove it!
我们可以证明这一点:使用 -m 打印逃逸分析结果。
-m表示 print optimization decisions。更多flag可以通过go tool compile -h查看。
$ go build -gcflags="-m" examples/esc/sum.go
# command-line-arguments
examples/esc/sum.go:21:13: inlining call to fmt.Println
examples/esc/sum.go:7:17: Sum make([]int, 100) does not escape
examples/esc/sum.go:21:13: answer escapes to heap
examples/esc/sum.go:21:13: main []interface {} literal does not escape
examples/esc/sum.go:21:13: io.Writer(os.Stdout) escapes to heap
<autogenerated>:1: (*File).close .this does not escape
从中可看出make([]int, 100)的结果没有逃逸到堆上。
answer逃逸到堆上了,原因是fmt.Println是一个可变参数函数(variadic function)。可变参数函数的参数被“打包”(boxed)为一个切片,在这个例子中就是[]interface{},所以answer被放入一个interface值,因为它被fmt.Println函数引用了。从Go 1.6开始,垃圾收集器要求所有通过interface传的值是指针,那么编译器看到的大概是:
var answer = Sum()
fmt.Println([]interface{&answer}...)
我们可以通过-gcflags="-m -m"来印证这一点。
% go build -gcflags='-m -m' examples/esc/sum.go 2>&1 | grep sum.go:21
examples/esc/sum.go:21:13: inlining call to fmt.Println func(...interface {}) (int, error) { var fmt..autotmp_3 int; fmt..autotmp_3 = <N>; var fmt..autotmp_4 error; fmt..autotmp_4 = <N>; fmt..autotmp_3, fmt..autotmp_4 = fmt.Fprintln(io.Writer(os.Stdout), fmt.a...); return fmt..autotmp_3, fmt..autotmp_4 }
examples/esc/sum.go:21:13: answer escapes to heap
examples/esc/sum.go:21:13: main []interface {} literal does not escape
examples/esc/sum.go:21:13: io.Writer(os.Stdout) escapes to heap
3.2.2. Exercises
(1)Does this optimisation hold true for all values of count?
不是,当count较大,比如为10000时,切片会逃逸到堆上。译者推测这是因为栈的空间有限,不能容纳很大的变量。
(2)Does this optimisation hold true if count is a variable, not a constant?
不是,把const count = 100改成var count = 100,其他代码不变,发现切片会逃逸到堆上。译者推测这是因为count是变量时,编译器无法确定其大小,保险起见就把切片分配到堆上。
(3)Does this optimisation hold true if count is a parameter to Sum?
不是,当count是Sum函数的参数时,切片会逃逸到堆上。 推测原因同(2),编译器无法确定切片大小。
通过基准测试可做进一步验证:
var result int

func BenchmarkSum(b *testing.B) {
	b.ReportAllocs()
	var r int
	for i := 0; i < b.N; i++ {
		r = Sum()
	}
	result = r
}
当count是常量时,测试结果表明没有堆内存分配:
goos: darwin
goarch: amd64
BenchmarkSum-12    	12470510	        88.1 ns/op	       0 B/op	       0 allocs/op
当count是变量时,测试结果表明有堆内存分配:
goos: darwin
goarch: amd64
BenchmarkSum-12    	 6184479	       182 ns/op	     896 B/op	       1 allocs/op
3.2.3. Escape analysis (continued)
type Point struct{ X, Y int }

const Width = 640
const Height = 480

func Center(p *Point) {
	p.X = Width / 2
	p.Y = Height / 2
}

func NewPoint() {
	p := new(Point)
	Center(p)
	fmt.Println(p.X, p.Y)
}
% go build -gcflags=-m examples/esc/center.go
# command-line-arguments
examples/esc/center.go:11:6: can inline Center
examples/esc/center.go:18:8: inlining call to Center
examples/esc/center.go:19:13: inlining call to fmt.Println
examples/esc/center.go:11:13: Center p does not escape
examples/esc/center.go:17:10: NewPoint new(Point) does not escape
examples/esc/center.go:19:15: p.X escapes to heap
examples/esc/center.go:19:20: p.Y escapes to heap
examples/esc/center.go:19:13: NewPoint []interface {} literal does not escape
examples/esc/center.go:19:13: io.Writer(os.Stdout) escapes to heap
<autogenerated>:1: (*File).close .this does not escape
尽管p是用new函数来分配的,它不会被存放在堆上,因为没有p的引用逃逸出Center函数。
但我们也发现p.X和p.Y逃逸到堆上了,这是为什么呢?
译注:理由同上一个例子中的 answer变量。
3.3. Inlining
在Go中函数调用是有固定开销(overhead)的;栈和抢占检查(preemption checks)。
硬件的分支预测可以改善这类开销,但它依旧是一个和函数大小、时钟周期相关的代价。
内联是一种避免这些开销的经典优化方法。
在Go 1.11 之前,内联只作用于叶子函数(leaf function)上。叶子函数是指不会调用其他函数的函数。这么做的理由是:
- 如果是做了很多事情的“大”函数,那么它的前导开销可以忽略不计。
- 而对于小函数来说,此类开销相对于它所做实际的工作是比较大的。对其使用内联,收益大。
另一个理由是重内联会使得栈追踪更加困难。
3.3.1. Inlining (example)
func Max(a, b int) int {
	if a > b {
		return a
	}
	return b
}

func F() {
	const a, b = 100, 20
	if Max(a, b) == b {
		panic(b)
	}
}
如前文一般,使用-gcflags=-m来查看编译器的优化决策。
% go build -gcflags=-m examples/inl/max.go
# command-line-arguments
examples/inl/max.go:4:6: can inline Max
examples/inl/max.go:11:6: can inline F
examples/inl/max.go:13:8: inlining call to Max
examples/inl/max.go:20:6: can inline main
examples/inl/max.go:21:3: inlining call to F
examples/inl/max.go:21:3: inlining call to Max
可见,函数Max被内联处理了。
3.3.2. What does inlining look like?
编译max.go,查看函数F()的优化版本。
% go build -gcflags=-S examples/inl/max.go 2>&1 | grep -A5 '"".F STEXT'
"".F STEXT nosplit size=1 args=0x0 locals=0x0 funcid=0x0 align=0x0
        0x0000 00000 (/Users/chenluxin/Codes/go/high-performance-go-workshop/03-compiler-optimisations/examples/max/max.go:11)  TEXT    "".F(SB), NOSPLIT|ABIInternal, $0-0
        0x0000 00000 (/Users/chenluxin/Codes/go/high-performance-go-workshop/03-compiler-optimisations/examples/max/max.go:11)  FUNCDATA        $0, gclocals·33cdeccccebe80329f1fdbee7f5874cb(SB)
        0x0000 00000 (/Users/chenluxin/Codes/go/high-performance-go-workshop/03-compiler-optimisations/examples/max/max.go:11)  FUNCDATA        $1, gclocals·33cdeccccebe80329f1fdbee7f5874cb(SB)
        0x0000 00000 (/Users/chenluxin/Codes/go/high-performance-go-workshop/03-compiler-optimisations/examples/max/max.go:16)  RET
        0x0000 c3                                               .
忽略FUNCDATA和PCDATA,剩下的就是RET,可见函数F()最终变成了:
func F() {
        return
}
3.3.3. Discussion
如果在函数F()中,把a和b声明为变量而非常量,或者a和b被当做参数传递给F(),结果会有变化吗?
实验结果是,两种情况下,Max和F函数都会被内联处理。但是在第二种情况中,打印出的汇编语句不一样了:
"".F STEXT size=103 args=0x10 locals=0x18
	0x0000 00000 (/Users/chenluxin/Codes/go/high-performance-go-workshop/03-compiler-optimisations/examples/max/max.go:11)	TEXT	"".F(SB), ABIInternal, $24-16
	0x0000 00000 (/Users/chenluxin/Codes/go/high-performance-go-workshop/03-compiler-optimisations/examples/max/max.go:11)	MOVQ	(TLS), CX
	0x0009 00009 (/Users/chenluxin/Codes/go/high-performance-go-workshop/03-compiler-optimisations/examples/max/max.go:11)	CMPQ	SP, 16(CX)
	0x000d 00013 (/Users/chenluxin/Codes/go/high-performance-go-workshop/03-compiler-optimisations/examples/max/max.go:11)	PCDATA	$0, $-2
	0x000d 00013 (/Users/chenluxin/Codes/go/high-performance-go-workshop/03-compiler-optimisations/examples/max/max.go:11)	JLS	96
3.4. Dead code elimination
为什么在上一个例子中,a和b是常数很重要?
为了理解发生了什么,我们从编译器视角看看将Max内联入F后的样子:
Before:
func Max(a, b int) int {
	if a > b {
		return a
	}
	return b
}

func F() {
	const a, b = 100, 20
	if Max(a, b) == b {
		panic(b)
	}
}
After:
func F() {
	const a, b = 100, 20
	var result int
	if a > b {
		result = a
	} else {
		result = b
	}
	if result == b {
		panic(b)
	}
}
因为a和b是常数,编译器能够在编译时期判断哪个分支是真,所以进一步将F优化为:
func F() {
	const a, b = 100, 20
	var result int
	if true {
		result = a
	} else {
		result = b
	}
	if result == b {
		panic(b)
	}
}
做分支消除(branch elimination):
func F() {
        const a, b = 100, 20
        const result = a
        if result == b {
                panic(b)
        }
}
可知result总是等于a,因为a是常数,所以result也是常数。编译器继续优化:
func F() {
        const a, b = 100, 20
        const result = a
        if false {
                panic(b)
        }
}
再次分支消除:
func F() {
        const a, b = 100, 20
        const result = a
}
最后就只有:
func F() {
}
3.4.1. Dead code elimination (cont.)
分支消除是 dead code elimination 这类优化手段中的一种。一段代码永远不会被执行,称之为 dead,因此就不需要被编译,不用包含到最终的二进制中。
我们可以利用这点来完成昂贵的debugging,将其隐藏在:
const debug = false
这可以和build tags一起使用。
译注:将debug有关的逻辑放在条件语句块中,只有debug为true时才会执行。这样,当debug为false时,这些代码不会被编译到二进制文件中。
3.4.2. Adjusting the level of inlining
通过-gcflags=-l来调整内联级别。
-gcflags=-l, 禁用内联-gcflags='-l -l'内联级别是 2,更激进,可能更快,可能会生成更大的二进制文件-gcflags='-l -l -l'内联级别是 3,更加激进,二进制文件肯定更大,也许会更快,但也可能带来问题-gcflags=-l=4将启用实验性的中栈内联(mid stack inlining optimisation)
3.4.3. Mid Stack inlining
从Go 1.12 开始,默认开启上述的中栈内联。
在Go 1.11以及之前的版本中,上个例子中的F()函数严格意义上来说并不是叶子函数——它调用了Max。由于内联的优化,F函数现在也被内联到它的调用者里了。这是因为,当Max函数内联到F后,F函数中没有其他函数调用,也变成了一个潜在的叶子函数。
3.4.4. Futher reading
- Using // +build to switch between debug and release builds
- How to use conditional compilation with the go build tool
3.5. Prove pass
编译器的SSA后端有一个叫做 prove pass 的特性。Prove建立了变量之间的关系。
看这个例子:
package main

func foo(x int32) bool {
	if x > 5 {
		if x > 3 {
			return true
		}
		panic("x less than 3")
	}
	return false
}

func main() {
	foo(-1)
}
注意到如果 x > 5,那么x > 3必定成立。
3.5.1. Prove it
编译器可以展示出prove pass的工作。将-d通过-gcflags传递给go tool compile。
% go build -gcflags=-d=ssa/prove/debug=on examples/prove/foo.go
# command-line-arguments
examples/prove/foo.go:5:10: Proved Greater64
编译器告诉我们,它已经证明了if x > 3这个分支总是为真。
3.6. Compiler intrinsics
Go允许我们使用汇编编写函数。这项技术涉及到一个forwarding declared函数——没有函数体的函数和一个对应的汇编函数。
// decl.go
package asm

// Add returns the sum of a and b.
func Add(a int64, b int64) int64
这里声明了一个没有函数体的函数。直接编译会报错:
$ go build decl.go
# command-line-arguments
./decl.go:4:6: missing function body
然后在该目录下添加汇编文件add.s。
TEXT ·Add(SB),$0
	MOVQ a+0(FP), AX
	ADDQ b+8(FP), AX
	MOVQ AX, ret+16(FP)
	RET
这时候就可以编译了。
不过还有一个问题,汇编函数不能内联。这点长期以来被开发者所抱怨。使用汇编要么是为了性能,要么是为了一些Go语言没有暴露的操作,矢量操作,原子操作等。由于不能内联,汇编函数要付出较高的开销。
已经有好几个内联的汇编语法的提案了,但都没有被接受。不过Go添加了intrinsic functions作为替代品。
一个 intrinsic function 也是用Go编写的,但是编译器会对其做替换。
有两个包使用了这项特性:
math/bitssync/atomic
这些替换是在编译器后端实现的。如果你的计算机架构支持某操作的更快方式,那么它会在编译时透明地替换为对应的指令。
除了生成更高效的代码外,由于intrinsic functions是正经的Go代码,内联也能应用于其上。
3.6.1. Popcnt example
在math/bits包中有一系列函数,OnesCount...,这些会被编译器识别然后替换为其native的等效体。
func BenchmarkMathBitsPopcnt(b *testing.B) {
	var r int
	for i := 0; i < b.N; i++ {
		r = bits.OnesCount64(uint64(i))
	}
	Result = uint64(r)
}
将其和手写的popcnt实现做基准测试对比。
$ go test -bench=.  ./examples/popcnt-intrinsic/
goos: darwin
goarch: amd64
cpu: Intel(R) Core(TM) i7-9750H CPU @ 2.60GHz
BenchmarkPopcnt-12              589211250                1.771 ns/op
BenchmarkMathBitsPopcnt-12      1000000000               0.4987 ns/op
PASS
ok      _/Users/chenluxin/Codes/go/high-performance-go-workshop/examples/popcnt-intrinsic       2.268s
可见后者要快上几倍。
3.6.2. Atomic counter example
下面是一个原子计数器的例子。
package main

import (
	"sync/atomic"
)

type counter uint64

func (c *counter) get() uint64 {
	return atomic.LoadUint64((*uint64)(c))
}
func (c *counter) inc() uint64 {
	return atomic.AddUint64((*uint64)(c), 1)
}
func (c *counter) reset() uint64 {
	return atomic.SwapUint64((*uint64)(c), 0)
}

var c counter

func f() uint64 {
	c.inc()
	c.get()
	return c.reset()
}

func main() {
	f()
}
由于内联和编译器intrinsics的作用,这段代码会被转化为高效的原生代码。
进阶阅读:
- Mid-stack inlining in the Go compiler presentation by David Lazar
- Proposal: Mid-stack inlining in the Go compiler
3.7. Bounds check elimination
Go是一门会做边界检查的语言。这意味着数组和切片的下标操作会被检查来确保在边界范围内。
对于数组,这可以在编译时完成。
对于切片,这必须在运行时完成。
var v = make([]int, 9)

var A, B, C, D, E, F, G, H, I int

func BenchmarkBoundsCheckInOrder(b *testing.B) {
	var a, _b, c, d, e, f, g, h, i int
	for n := 0; n < b.N; n++ {
		a = v[0]
		_b = v[1]
		c = v[2]
		d = v[3]
		e = v[4]
		f = v[5]
		g = v[6]
		h = v[7]
		i = v[8]
	}
	A, B, C, D, E, F, G, H, I = a, _b, c, d, e, f, g, h, i
}
使用
-gcflags=-s来对BenchmarkBoundsCheckInOrder反汇编。看看每次循环里有多少次边界检查的操作?
func BenchmarkBoundsCheckOutOfOrder(b *testing.B) {
	var a, _b, c, d, e, f, g, h, i int
	for n := 0; n < b.N; n++ {
		i = v[8]
		a = v[0]
		_b = v[1]
		c = v[2]
		d = v[3]
		e = v[4]
		f = v[5]
		g = v[6]
		h = v[7]
	}
	A, B, C, D, E, F, G, H, I = a, _b, c, d, e, f, g, h, i
}
译者尝试后发现不知道咋看汇编(因为不会)。 但是从文章边界检查消除得到启示,使用如下方法查看是否有边界检查操作:
$ go test -gcflags="-d=ssa/check_bce/debug=1" bounds_test.go
# command-line-arguments [command-line-arguments.test]
./bounds_test.go:13:8: Found IsInBounds
./bounds_test.go:14:9: Found IsInBounds
./bounds_test.go:15:8: Found IsInBounds
./bounds_test.go:16:8: Found IsInBounds
./bounds_test.go:17:8: Found IsInBounds
./bounds_test.go:18:8: Found IsInBounds
./bounds_test.go:19:8: Found IsInBounds
./bounds_test.go:20:8: Found IsInBounds
./bounds_test.go:21:8: Found IsInBounds
./bounds_test.go:32:8: Found IsInBounds
ok      command-line-arguments  0.435s [no tests to run]
这表明,在BenchmarkBoundsCheckInOrder中,循环里每个下标操作都做了边界检查;而在BenchmarkBoundsCheckOutOfOrder中,只有第一个下标操作i = v[8]做了边界检查,后续操作不必检查了,这也是意料之中的。
3.7.1. Exercises
- 对下表操作的顺序重新排列是否会影响函数的大小?是否会影响函数的速度?
译者答:函数的大小我不知道怎么测量(TODO)。速度可以看基准测试结果。
$ go test -bench=. bounds_test.go
goos: darwin
goarch: amd64
cpu: Intel(R) Core(TM) i7-9750H CPU @ 2.60GHz
BenchmarkBoundsCheckInOrder-12          556275300                2.124 ns/op
BenchmarkBoundsCheckOutOfOrder-12       678888108                1.820 ns/op
PASS
ok      command-line-arguments  2.922s
可见BenchmarkBoundsCheckOutOfOrder速度更快一些。这是合理的,毕竟省去了大部分边界检查操作。
- 如果
v被移入到Benchmark函数内部会怎么样?
译者答:修改后测试结果如下。
$ go test -bench=. bounds_test.go
goos: darwin
goarch: amd64
cpu: Intel(R) Core(TM) i7-9750H CPU @ 2.60GHz
BenchmarkBoundsCheckInOrder-12          1000000000               0.5067 ns/op
BenchmarkBoundsCheckOutOfOrder-12       1000000000               0.4998 ns/op
PASS
ok      command-line-arguments  1.530s
可见两个函数速度相近,都比原来快了不少。
$ go test -gcflags="-d=ssa/check_bce/debug=1" bounds_test.go
ok      command-line-arguments  0.648s [no tests to run]
神奇的事情发生了!两个函数都没有边界检查了。这是为什么呢?(TODO:我猜测因为v变成了函数内的局部变量,编译器可以确定其长度不小于9,后续的下标操作也就不可能越界。而当v是全局变量时无法作此保证。)
- 如果
v声明为数组,var v [9]int,会怎么样?
译者答:测试结果如下。
$  go test -bench=. bounds_test.go
goos: darwin
goarch: amd64
cpu: Intel(R) Core(TM) i7-9750H CPU @ 2.60GHz
BenchmarkBoundsCheckInOrder-12          951649609                1.252 ns/op
BenchmarkBoundsCheckOutOfOrder-12       877896614                1.269 ns/op
PASS
ok      command-line-arguments  2.680s
可见,比声明为切片时要快一些。
$ go test -gcflags="-d=ssa/check_bce/debug=1" bounds_test.go
ok      command-line-arguments  0.883s [no tests to run]
也都没有了边界检查。为什么?(TODO:我猜测是因为数组的长度和容量都是固定的,所以编译时就能知道没有越界了,无需在运行时检查。)
3.8. Compiler flags exercises
编译器的flags是通过:
go build -gcflags=$FLAGS
来提供的。
一些常用的flag如下:
-S打印出被编译的包的汇编-l控制内联的行为-m控制打印出编译器的优化决策,比如内联,逃逸分析。-m -m打印出更多细节。-l -N关闭所有的优化-d=ssa/prove/debu=on,这个参数也接收2及以上的值-d也接受其他的值,使用go tool compile -d help来查看。
如果发现后续的
go build ...不产生任何输出,要把工作目录下的生成二进制删掉。
3.8.1. Further reading
4. Execution Trace
TODO
5. Memory and Garbage Collector
5.1. Garbage collector world view
任何垃圾回收器的目的都是让程序“觉得”有无限的内存可供使用。
一个stop the world,标记清除的GC在总运行时间方面是最有效的,它适用于批处理、模拟程序。然而,随着时间推移,Go的GC从一个纯stop the world的收集器变成了一个并发的,非压缩(non compacting)的收集器。这是因为Go GC是为低延迟服务和交互式应用设计的。
Go GC 在设计上更偏重于低延迟(lower_latency),而不是最大吞吐量(maximum_throughput)。
5.2. Garbage collector design
- Go 1.0,基于tcmalloc的stop the world 标记清除的收集器
- Go 1.3,精确地收集器,不会弄错堆上的指针数量,从而造成内存泄漏
- Go 1.5,新的GC设计,专注于latency优先于throughput
- Go 1.6,GC优化,以更低的延迟处理更大的堆
- Go 1.7,小的GC优化,主要是重构
- Go 1.8,减少STW时间,缩减到100微秒内
- Go 1.10+,移除纯合作式的goroutine调度以降低触发完全GC时的延迟
- Go 1.13,重写Scavenger
5.2.1. Garbage collector tuning
Go 运行时提供了一个环境变量 GOGC,用作GC的调优。它的默认值是100。
公式: goal = reachable * (1 + GOGC/100)
举个例子:当前堆内存是256MB,那么当堆满时,它会增长到256*(1+100/100)=512MB。
所以:
- GOGC 大于100时,堆增长得快,GC压力小
- GOGC 小于100时,堆增长得慢,GC压力大
实践中,GOGC的值要根据生产环境负载进行观测和调整。
译注:公式里的goal,我理解是GC后要达到的堆内存大小。
5.2.2. VSS and the scavenger
应用程序的生命周期有多个阶段:启动,稳定态,关闭。不同阶段的内存状态是不一样的。启动时可能会处理或者汇总大量的数据。稳态时的内存消耗量可能和连接的客户端数量或者请求速率正相关。关闭时的内存消耗量可能和稳态时处理的数据量或者要写到磁盘上的数据量正相关。
程序在启动时可能要比其他时期使用的内存都要多,那么它的堆就会比真正必须要用的大,大部分都没备用。如果Go运行时能够告诉操作系统,堆里面的哪些部分是不需要的,这会非常有用。
在Go 1.13中,scavenging从一个周期性的后台操作变成了一个需求驱动的操作。这样长期运行的程序应该可以更加高效地将内存归还给操作系统。
5.2.3. Garbage collector monitoring
一种简单的方法是查看GC的日志。设置环境变量GODEBUG=gctrace=1,再启动程序,就可将GC的日志打印出来。
例如:env GODEBUG=gctrace=1 godoc -http=:8080,示例输出如下:
gc 1 @0.024s 0%: 0.038+0.54+0.027 ms clock, 0.46+0.80/0.74/0+0.32 ms cpu, 4->4->0 MB, 5 MB goal, 12 P
gc 2 @0.029s 1%: 0.065+0.43+0.061 ms clock, 0.78+0.69/0.61/0+0.73 ms cpu, 4->4->0 MB, 5 MB goal, 12 P
gc 3 @0.033s 1%: 0.051+0.40+0.027 ms clock, 0.61+0.60/0.81/0+0.32 ms cpu, 4->4->1 MB, 5 MB goal, 12 P
gc 4 @0.036s 2%: 0.057+0.45+0.030 ms clock, 0.68+1.1/0.69/0+0.36 ms cpu, 4->4->1 MB, 5 MB goal, 12 P
gc 5 @0.040s 2%: 0.056+0.38+0.007 ms clock, 0.67+1.0/0.59/0+0.085 ms cpu, 4->4->1 MB, 5 MB goal, 12 P
关于这些数字的含义,参看 runtime 包的文档:
gctrace: setting gctrace=1 causes the garbage collector to emit a single line to standard error at each collection, summarizing the amount of memory collected and the length of the pause. The format of this line is subject to change.
Currently, it is:
	gc # @#s #%: #+#+# ms clock, #+#/#/#+# ms cpu, #->#-># MB, # MB goal, # P
where the fields are as follows:
	gc #        the GC number, incremented at each GC
	@#s         time in seconds since program start
	#%          percentage of time spent in GC since program start
	#+...+#     wall-clock/CPU times for the phases of the GC
	#->#-># MB  heap size at GC start, at GC end, and live heap
	# MB goal   goal heap size
	# P         number of processors used
The phases are stop-the-world (STW) sweep termination, concurrent
mark and scan, and STW mark termination. The CPU times
for mark/scan are broken down in to assist time (GC performed in
line with allocation), background GC time, and idle GC time.
If the line ends with "(forced)", this GC was forced by a
runtime.GC() call.
这个环境变量可以在生产环境中使用,不会对性能带来负面影响。因为这些数据总会被收集,设置这个变量的作用只是把它们展示出来罢了。
更加通用的监测Go程序的方法是使用 net/http/pprof 接口。
import _ "net/http/pprof"
引用net/http/pprof会在/debug/pprof上注册一个handler,这个handler提供了一系列的runtime指标。
5.3. Minimise allocations
请牢记,内存分配不是免费的,不论使用的语言是否有GC机制。
5.3.1. strings vs []bytes
在Go中,string的值是不可变的,而[]byte是可变的。
大部分程序喜欢使用string,而大部分IO是操作[]byte的。
尽量避免将[]byte转换为string,这意味着要给值选定一种表现形式,要么是string,要么是[]byte。如果数据是从网络或者磁盘读取的,那就选择[]byte。
bytes 包中有很多函数和strings包相同,如 Split,Compare,HasPrefix等。
其实,strings和bytes包使用相同的汇编原语。
5.3.2. Using []byte as a map key
使用string作为map的key是非常常见的,然而有时候我们的key是[]byte形式的。 slice没有等值操作符,不能被用作map的key,因此需要转成string。
var m map[string]string
v, ok := m[string(bytes)]
对于这种写法,编译器做出了优化,避免了在map查找时将byte slice转化成string。这是一种很特殊的情况,如果写成下面的形式这个优化就不会生效了:
key := string(bytes)
val, ok := m[key]
5.3.3. []byte to string conversions
Go 1.13的新特性
比较两个[]byte切片的相等性要么是将其转化为string再作比较(会有copy操作),要么是使用bytes.Equal函数。
好消息是在Go 1.13中,编译器做出了优化,为了相等性测试的[]byte到string的转化会避免内存分配。
func BenchmarkBytesEqualInline(b *testing.B) {
	x := bytes.Repeat([]byte{'a'}, 1<<20)
	y := bytes.Repeat([]byte{'a'}, 1<<20)
	b.ReportAllocs()
	b.ResetTimer()
	for n := 0; n < b.N; n++ {
		if string(x) != string(y) {
			b.Fatal("x != y")
		}
	}
}

func BenchmarkBytesEqualExplicit(b *testing.B) {
	x := bytes.Repeat([]byte{'a'}, 1<<20)
	y := bytes.Repeat([]byte{'a'}, 1<<20)
	b.ReportAllocs()
	b.ResetTimer()
	for n := 0; n < b.N; n++ {
		q := string(x)
		r := string(y)
		if q != r {
			b.Fatal("x != y")
		}
	}
}
这个基准测试的结果是:
$ go test -bench=. -benchmem ./examples/byteseq/
goos: darwin
goarch: amd64
cpu: Intel(R) Core(TM) i7-9750H CPU @ 2.60GHz
BenchmarkBytesEqualInline-12               33896             34113 ns/op               0 B/op          0 allocs/op
BenchmarkBytesEqualExplicit-12              3100            353143 ns/op         2097157 B/op          2 allocs/op
PASS
ok      _/Users/chenluxin/Codes/go/high-performance-go-workshop/examples/byteseq        4.148s
可见BenchmarkBytesEqualExplicit有内存分配操作,而BenchmarkBytesEqualInline没有。注意到,内存分配量2097157 B/op就是代码中两个[]byte的大小之和。
5.3.4. Avoid string concatenation
Go里的string是不可变的,拼接两个string会产生第三个string。下面这些代码段中哪个最快?
s := request.ID
s += " " + client.Addr().String()
s += " " + time.Now().String()
r = s
var b bytes.Buffer
fmt.Fprintf(&b, "%s %v %v", request.ID, client.Addr(), time.Now())
r = b.String()
r = fmt.Sprintf("%s %v %v", request.ID, client.Addr(), time.Now())
b := make([]byte, 0, 40)
b = append(b, request.ID...)
b = append(b, ' ')
b = append(b, client.Addr().String()...)
b = append(b, ' ')
b = time.Now().AppendFormat(b, "2006-01-02 15:04:05.999999999 -0700 MST")
r = string(b)
var b strings.Builder
b.WriteString(request.ID)
b.WriteString(" ")
b.WriteString(client.Addr().String())
b.WriteString(" ")
b.WriteString(time.Now().String())
r = b.String()
基准测试结果如下:
$ go test -bench=. ./examples/concat
goos: darwin
goarch: amd64
cpu: Intel(R) Core(TM) i7-9750H CPU @ 2.60GHz
BenchmarkConcatenate-12          1522419               818.2 ns/op           245 B/op          8 allocs/op
BenchmarkFprintf-12               984444              1203 ns/op             397 B/op         11 allocs/op
BenchmarkSprintf-12              1081072              1648 ns/op             269 B/op          9 allocs/op
BenchmarkStrconv-12              2122136               572.4 ns/op           165 B/op          5 allocs/op
BenchmarkStringsBuilder-12       1000000              1038 ns/op             255 B/op          9 allocs/op
PASS
ok      _/Users/chenluxin/Codes/go/high-performance-go-workshop/examples/concat 9.741s
可见,第四种方法最高效,内存分配操作次数和分配量都是最少的。
5.3.5. Don’t force allocations on the callers of your API
确保你的API允许调用方减少产生的垃圾量。
考虑下面两个Read方法:
func (r *Reader) Read() ([]byte, error)
func (r *Reader) Read(buf []byte) (int, error)
第一个Read方法没有参数,以[]byte的类型返回一些数据。第二个Read方法以[]byte buffer作为参数,返回读取的bytes数。
第一个方法总是会分配一个buffer,给GC带来压力。而第二个方法填充给定的buffer。
5.3.6. Preallocate slices if the length is known
Append操作很方便,但也很浪费。
Slices以翻倍速度增大直到1024个元素,之后以大约25%的幅度增大。看下面这段代码:
func main() {
	b := make([]int, 1024)
	b = append(b, 99)
	fmt.Println("len:", len(b), "cap:", cap(b))
}
在译者的电脑上(Go 1.18)结果是:
len: 1025 cap: 1536
可见,capacity增大了50%。(和上面的说法25%不符合,猜测是版本原因)。
这样拷贝了很多数据,产生了大量垃圾。
如果预先知道slice的长度,那就可以预分配空间,来避免拷贝。
Before:
var s []string
for _, v := range fn() {
        s = append(s, v)
}
return s
After:
vals := fn()
s := make([]string, len(vals))
for i, v := range vals {
        s[i] = v
}
return s
5.4. Using sync.Pool
注意:
sync.Pool不是缓存。它可以在任意时刻被清空。不要把重要的数据放在sync.Pool中,它们会被丢弃。
sync.Pool是用来重用一般的对象的。
sync.Pool没有固定的大小,也没有最大的容量。你往里面添加数据,从里面取用数据,直到发生一次GC,然后它就被无条件地清空了。这一点是by design的:
If before garbage collection is too early and after garbage collection too late, then the right time to drain the pool must be during garbage collection. That is, the semantics of the Pool type must be that it drains at each garbage collection. — Russ Cox
看这段代码:
var pool = sync.Pool{New: func() interface{} { return make([]byte, 4096) }}

func fn() {
	buf := pool.Get().([]byte) // takes from pool or calls New
	// do work
	pool.Put(buf) // returns buf to the pool
}
在Go 1.13中,sync.Pool会在每次GC时清空的行为可能会改变。
译注:尚未求证最新版本的行为。
5.5. Rearrange fields for better packing
考虑下面这个结构体:
type S struct {
	a bool
	b float64
	c int32
}
该类型的实例占用多少内存?
var s S
fmt.Println(unsafe.Sizeof(s))
答案是:在64位系统上是24bytes,在32位系统上是16bytes。
译注:在本人的电脑上是24字节。
为什么呢?原因和padding、alignment有关。
float64类型的值占用8 bytes,所以它们必须位于是8的倍数的地址上。这被称为 natual alignment,因为这是CPU天然的预期。在一些非Intel的平台上,不允许对没有对齐的值操作。即使是在支持unaligned access的平台上,对这些值访问也是有代价的。
注意:即使是在允许unaligned access的平台上,
sync/atomic也要求值是天然对齐的。这是因为原子操作是在L1,L2,L3缓存层上实现的,它们只在缓存线(cache line,32-64字节宽度)的里work。原子访问不能跨越cache line,所以它们必须正确地对齐。参见issue 599。
知道了alignment是如何工作的,我们可以推断编译器会在内存里把结构体里的域按照如下方式排列:
type S struct {
	a bool
	_ [7]byte // padding
	b float64
	c int32
	_ [4]byte // padding
}
这里,7 字节的padding是为了保证 b float64 在8 字节的边界上开始,4 字节的padding是为了保证S的数组或者切片在内存里是正确对齐的。
将结构体改写为
type S struct {
	a bool
	c int32
	b float64
}
大小减小到了16 字节。
进阶阅读:Padding is hard。
5.6. Exercises
略
6. Tips and trips
6.1. Goroutines
Goroutine 使用起来简单,创建所耗费的资源也少,可以认为是几乎免费的。 每个goroutine的stack至少会消耗一定量的内存,目前这个值是2KiB。 这么一算,1000000个goroutine即使什么都不干,也会消耗掉2GB的内存。这也不算少了。
6.1.1. Know when to stop a goroutine
每次使用go关键字启动goroutine时,我们要确保自己知道这个goroutine会在什么时候退出,以何种方式退出。
当然,也有少数例外——某些goroutine会一直运行,直到程序退出。
如果我们不知道goroutine会在何时以何种方式退出,这就可能造成潜在的内存泄漏,因为goroutine的栈内存会固定在堆上,还有从栈上可触达的分配在堆上的变量。
如果不知道一个goroutine会如何停止,那么就不要启动它。
6.1.2. Further reading
- Concurrency Made Easy (video)
- Concurrency Made Easy (slides)
- Never start a goroutine without knowning when it will stop (Practical Go, QCon Shanghai 2018)
6.2. Go uses efficient network polling for some requests
Go运行时使用高效的OS轮询机制(kqueue,epoll,windows IOCP,等)来处理网络IO。单个OS线程服务于很多个等待中的goroutine。
但是,对于本地文件IO,Go并没有实现任何的IO轮询。每个对*os.File的操作都会消耗一个OS线程。
对本地文件IO的重度使用可能导致消耗成百上千个线程,这也许会超过OS允许的范围。磁盘系统也不太可能去处理成百上千个并发的IO请求。
为了限制阻塞IO的并发度,建议使用worker goroutine pool,或者用一个带缓冲区的channel作为信号量(semaphore)。
var semaphore = make(chan struct{}, 10)

func processRequest(work *Work) {
	semaphore <- struct{}{} // acquire semaphore
	// process request
	<-semaphore // release semaphore
}
6.3. Watch out for IO multipliers in your application
在编写服务端程序时,不要让客户端请求消耗大量的服务器资源。注意:
- 每个请求的IO请求量;每个客户端请求会产生多少IO事件?
- 一个查询需要多少次读操作?这个次数是固定的,还是线性的?
尽量避免在请求上下文中执行IO操作。
6.4. Use streaming IO interfaces
- 尽量避免将数据读入
[]byte,然后到处传递。因为这可能会导致将MB量级的数据读入内存,增大GC的压力,进而增加程序的latency。 - 使用
io.Reader和io.Writer构建数据处理的流水线,来限制单个请求的内存使用量。 - 如果大量使用了
io.Copy,考虑实现io.ReaderFrom和io.WriterTo接口。这些接口更加高效,避免了将内存拷贝到临时缓冲区中。
6.5. Timeouts, timeouts, timeouts
永远不要做任何不知道其最大耗时的IO操作。
对于每个网络请求,都要设置超时时间,使用SetDeadline,SetReadDeadline,SetWriteDeadline。
译注:这三个都是
net.Conn的方法。
6.6. Defer is expensive, or is it?
在Go 1.13之前,defer是昂贵的,因为使用了闭包。
defer mu.Unlock()
等价于
defer func() {
        mu.Unlock()
}()
在Go 1.13中得到了优化,defer分配在栈上了,没有了闭包在堆上的开销。
6.7. Make the fast path inlinable
函数的大小和复杂度会影响编译器对其内联的能力。Mid stack inlining 可以内联函数的快速路径(fast path),消除快速路径中的函数调用开销。
译注(TODO):什么叫做 mid stack inlining ?
6.8. Range
作者给了两个例子,让读者预测benchmark结果。
var X [1 << 15]struct {
	val int
	_   [4096]byte
}

var Result int

func BenchmarkRange(b *testing.B) {
	var r int
	for n := 0; n < b.N; n++ {
		for _, x := range X {
			r += x.val
		}
	}
	Result = r
}

func BenchmarkFor(b *testing.B) {
	var r int
	for n := 0; n < b.N; n++ {
		for i := 0; i < len(X); i++ {
			x := &X[i]
			r += x.val
		}
	}
	Result = r
}
我预测是BenchmarkRange更慢,理由是在for ... range语句块中,变量x的内存地址总是保持不变的,每次迭代都需要对x赋值,这就涉及到内存操作(注意不是内存分配)。而在BenchmarkFor中,每次迭代就是直接取数组中元素的值即可。
测试运行的结果也印证了上述说法:
$ go test -bench=. -benchmem ./examples/range
goos: darwin
goarch: amd64
cpu: Intel(R) Core(TM) i7-9750H CPU @ 2.60GHz
BenchmarkRange-12             40          28147737 ns/op               0 B/op          0 allocs/op
BenchmarkFor-12             9775            119968 ns/op               0 B/op          0 allocs/op
PASS
ok      _/Users/chenluxin/Codes/go/high-performance-go-workshop/examples/range  3.784s
6.9. Avoid Finalisers
析构(finalisation)是一种指定对象在即将要被垃圾回收时的行为的技术。析构是不确定的(non deterministic)。
如果对象被任何其他对象引用,那么不会发生析构行为。
析构发生在gc过程中,这意味着其发生时间是不可预测的。而且这也和减少gc操作的目标相悖。
译注:设置析构函数是通过
runtime.SetFinalizer做到的,关于什么时候使用这种技术还需要进一步学习。
6.10. Minimise cgo
使用cgo是有代价的。
cgo调用类似于阻塞IO,会消耗线程。
不要在循环(tight loop)中调用C代码。
6.11. Always use the latest released version of Go
不必多说。
Comments